
Welcome back to Analyze Minnesota! In my inaugural post, I embarked on a journey to explore the depths of Minnesota’s data landscape. Today, I’m excited to present my very first content: a series of illuminating data visualizations that shed light on Minnesota campaign contributions. As you might recall from my earlier post, data visualization is more than just creating pretty charts; it’s about transforming complex data into clear, actionable insights. In this case, I’m turning numbers and statistics related to campaign contributions into visually compelling narratives.
Introducing the Plots
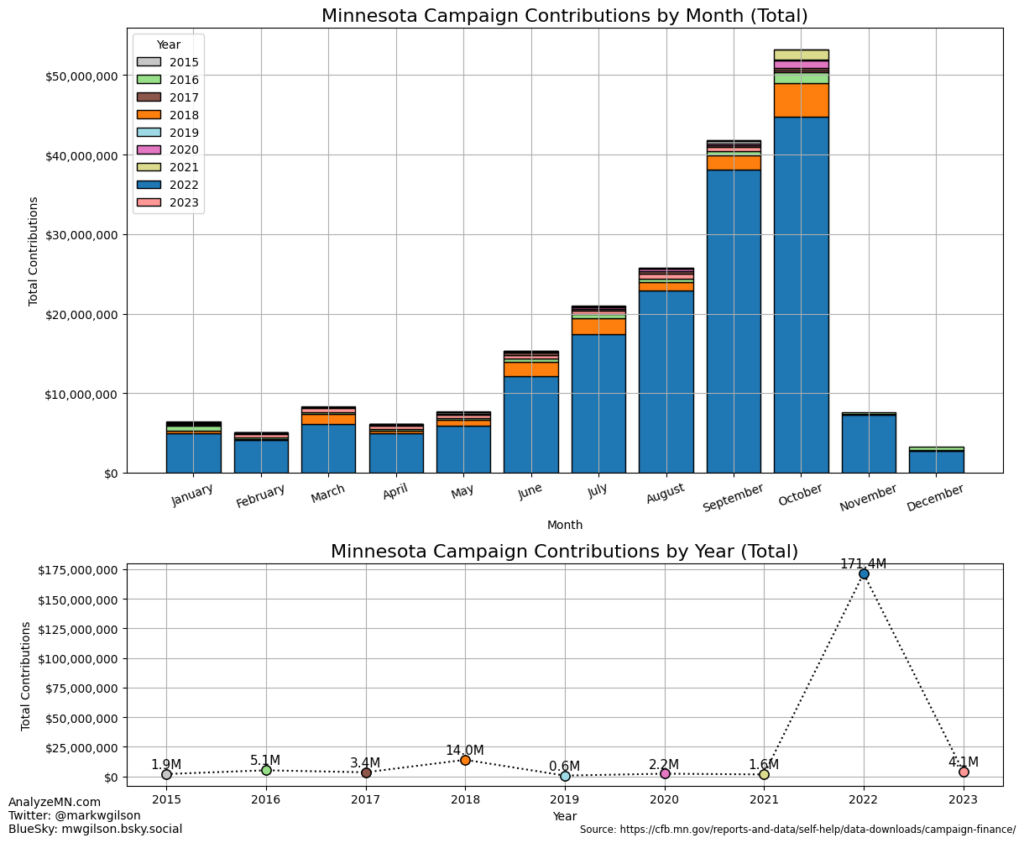
I’ve extracted and analyzed data from the Minnesota Campaign Finance Board, and I’m ready to share my findings. Here are the three plots I’ll be exploring:
Total Contributions
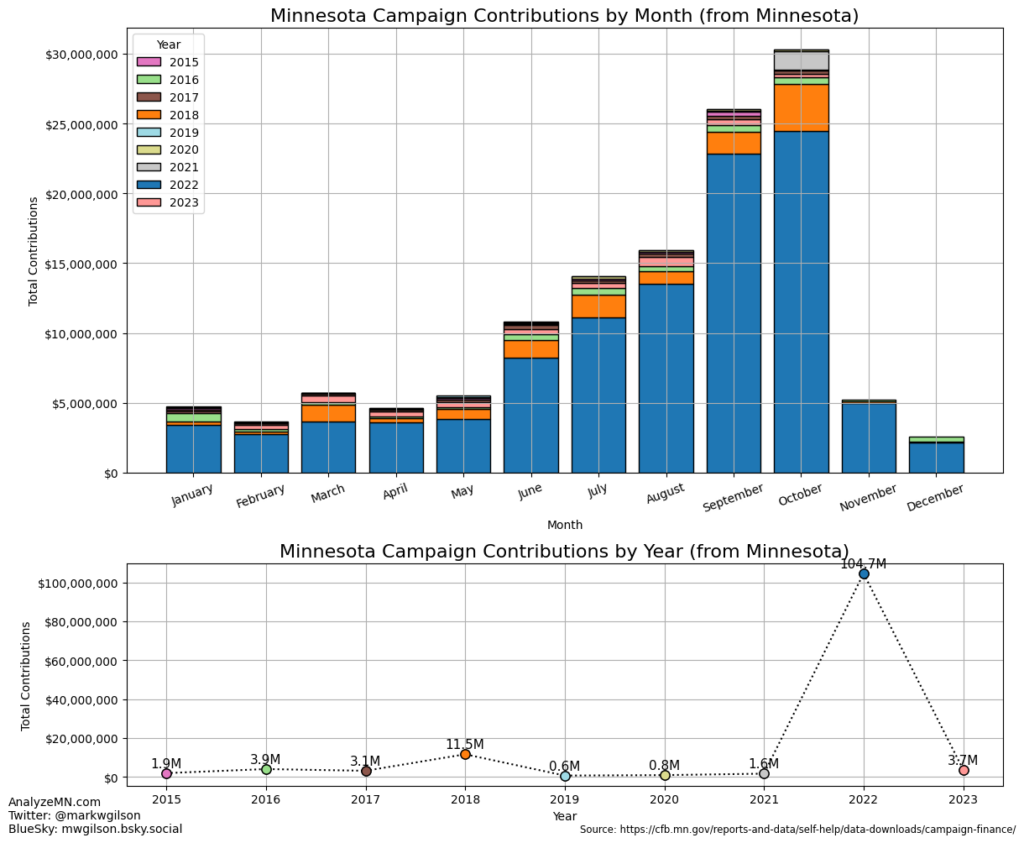
In State Contributions
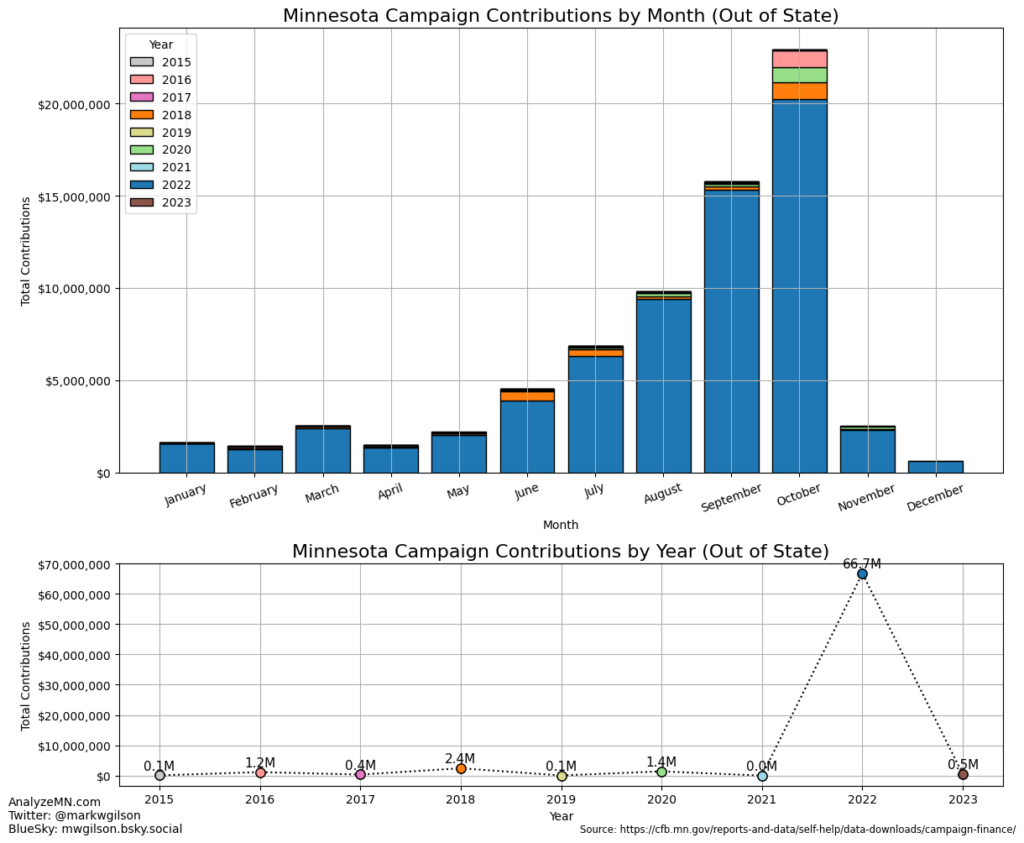
Out of State Contributions
Insights and Findings
In my exploration of Minnesota campaign contributions, a couple of striking findings have emerged. First, the substantial spike in campaign contributions during the month of October becomes quite intuitive when I consider that elections are typically held in November. It’s a reflection of the heightened political activity and fundraising efforts leading up to the election, as candidates and parties seek to garner support and secure the necessary resources for their campaigns. This seasonal trend highlights the significance of timing in campaign finance.
However, what truly stands out is the unprecedented surge in campaign contributions witnessed in 2022. During this year, I observed an astonishing $66.7 million in out-of-state contributions and a staggering $104.7 million in in-state contributions. These figures are exceptional when compared to previous years, with the next closest record being in 2018, where out-of-state contributions amounted to $2.4 million and in-state contributions reached $11.5 million. The vast disparity between 2022 and previous years raises questions about the factors and events that contributed to this extraordinary influx of campaign funds. Understanding the dynamics behind these numbers could provide valuable insights into the evolving landscape of political fundraising and influence in Minnesota.
What’s Next?
I’m excited to share these visualizations with you and encourage you to explore them in-depth. Each plot paints a different facet of the campaign contribution landscape, raising questions and sparking curiosity about the data’s underlying stories.
In my upcoming posts, I’ll dive even deeper into Minnesota’s data landscape, exploring a breakdown of contributions by zip code with an interactive map. Stay tuned for more insights, visualizations, and data-driven discoveries.
Data Source:
https://cfb.mn.gov/reports-and-data/self-help/data-downloads/campaign-finance/