
In an effort to understand the dynamics of criminal activity in Hennepin County, I decided turn to arrest data – a revealing source of truths often overlooked. What sort of crime is prevalent? What’s the age distribution for various arrest categories, and what sort of recidivism rate occurs in Hennepin County? This post delves into the age distribution across various arrest categories and examines the statistics on repeat offenses, providing a data-driven perspective on the patterns that emerge from the Hennepin County Jail Roster.
Hennepin County Crime: July-Dec 2023 Data
All data contained within these plots is derived from the Hennepin County Jail Roster, which is publicly available. This study adheres to strict privacy standards, utilizing only anonymized data without revealing any personal information. Covering a significant six-month period from July 1st to December 31st, 2023, the plots provide a detailed snapshot of criminal activity in Hennepin County during this interval.
Deciphering Crime Trends: A Colorful Insight into Hennepin County’s Arrest Patterns
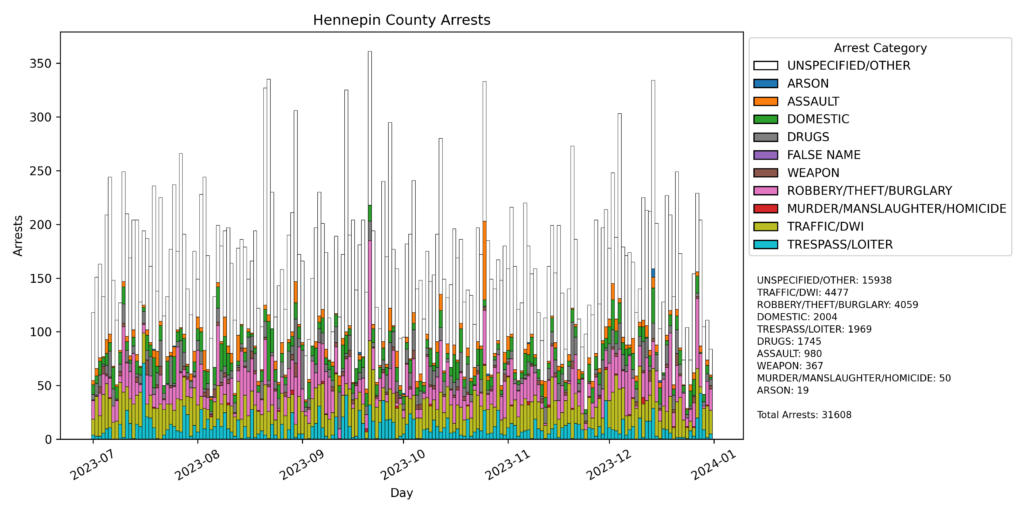
The first visualization offers a clear and insightful view of arrest patterns in Hennepin County, categorized by offense nature. Envision this as a colorful, detailed calendar that reveals not just the timing of arrests but also the prevalence of various crime types on any given day. The design, akin to a stacked bar chart, employs distinct colors to represent different offense categories, such as traffic violations, theft, or drug-related crimes. This design allows for immediate recognition of the most frequent offense types and the day-to-day variation in these trends. A notable concentration of one color on certain days signals a higher incidence of arrests for that particular crime category. This information proves invaluable for community members seeking to understand local crime patterns and for authorities in charge of resource allocation and crime prevention strategies. Furthermore, the plot includes precise counts for each category and the total number of arrests, serving as a comprehensive yet accessible source of information. This visualization is designed to provide a clear and practical understanding of complex data, beneficial to local residents, community leaders, and those interested in local crime statistics.
Unveiling Age Dynamics: Analyzing Arrest Age Distribution by Crime Category in Hennepin County
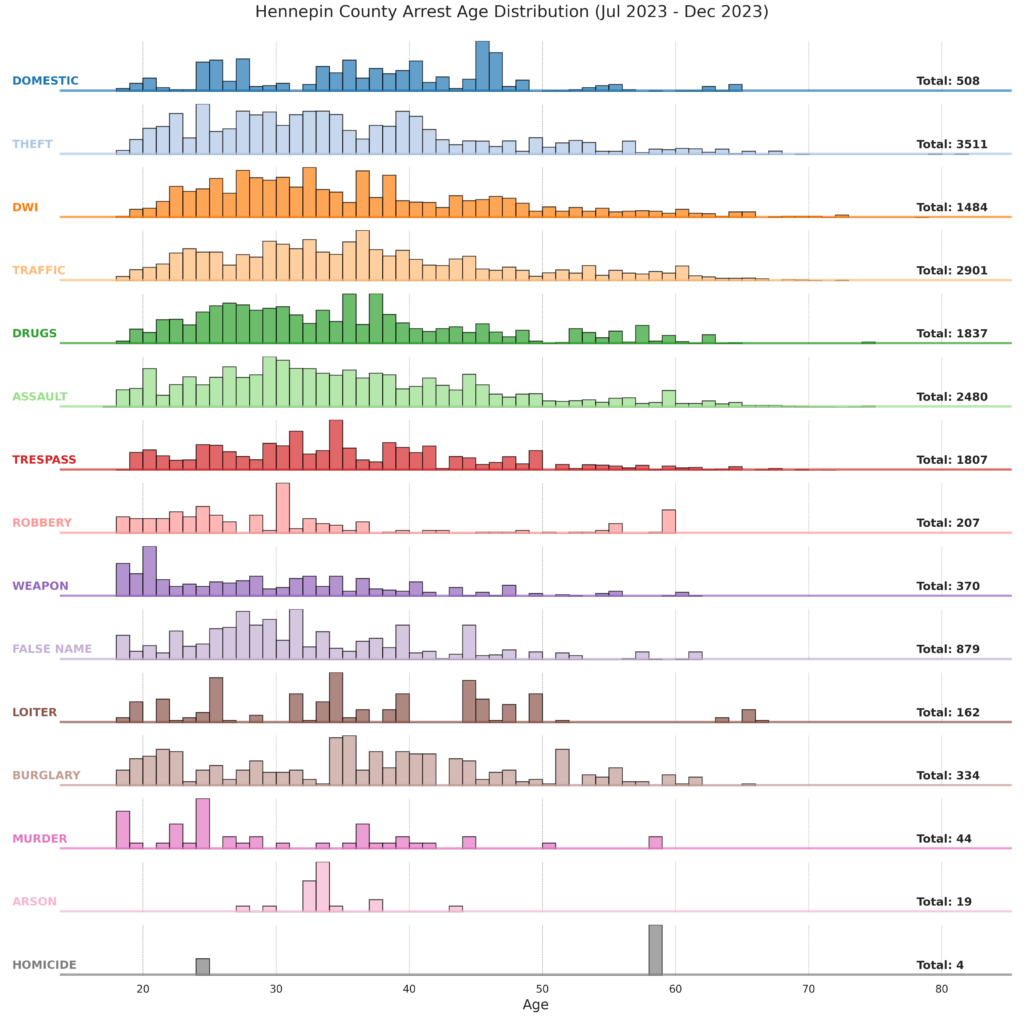
The next visualization provides an insightful look at the age distribution of individuals arrested in Hennepin County for various crime categories, from July through December 2023. The plot is designed as a series of horizontal histograms, often called ‘ridge plots’, with each line representing a different category of crime such as drugs, traffic violations, assault, or theft. This plot is like a detailed demographic map of crime in the county. Each ridge shows the distribution of ages for arrests within a specific crime category. For example, if a ridge is broader at younger ages, it indicates that more young people were arrested for that type of crime. Conversely, if it’s broader at older ages, it suggests that crime is more prevalent among older individuals. One of the practical uses of this visualization is its ability to highlight age trends in criminal behavior within specific categories. Community leaders, policymakers, and law enforcement can use this information to tailor their strategies and resources more effectively. For instance, if a particular crime is predominantly committed by younger individuals, preventive measures could focus more on youth engagement and education. Additionally, the plot includes the total number of arrests in each category, adding context to the age distributions. This makes it easier for readers to understand the scale of each type of crime in relation to others.
Recidivism Revealed: Dissecting Repeat Arrest Frequencies
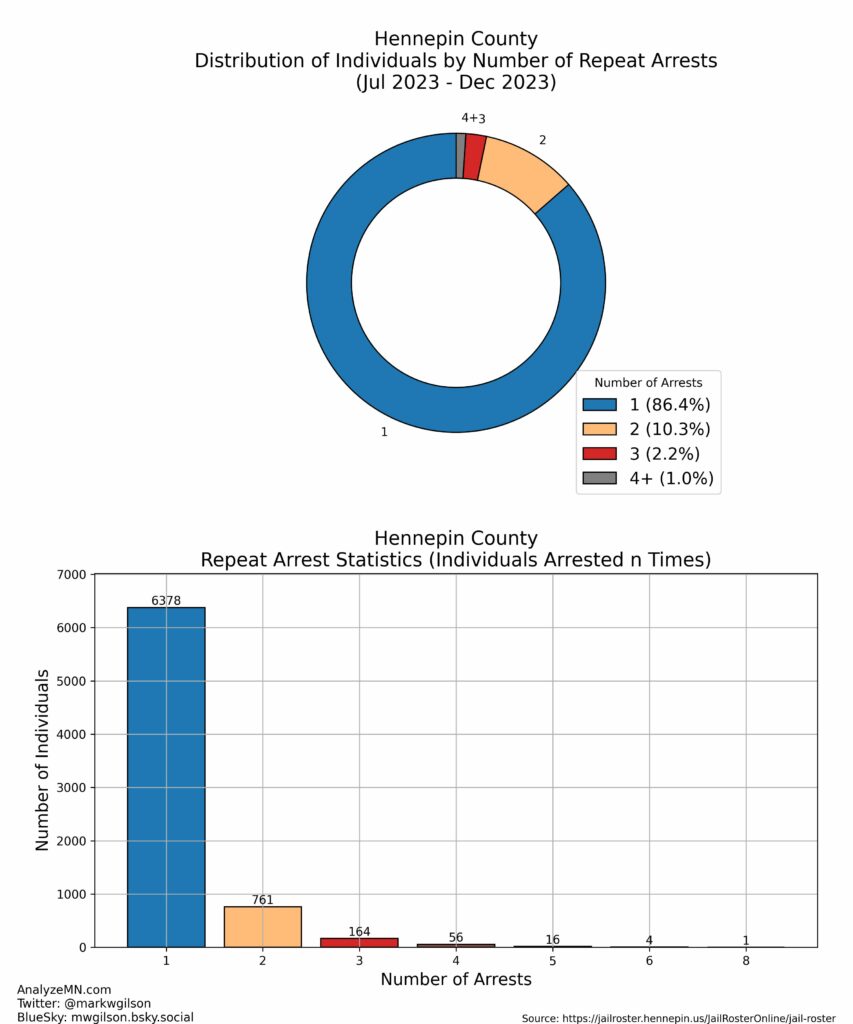
This next graphic, a pair of plots, provides a compelling view of repeat arrest patterns in Hennepin County. Comprising a doughnut chart and a bar graph, these plots break down the frequency of individuals who have been arrested multiple times, offering a snapshot of recidivism in the area. The doughnut chart is particularly intuitive, showing the proportion of individuals who have been arrested a specific number of times (1 to 3 times and 4 or more times). For instance, a larger section for ‘1 time’ arrests indicates a higher proportion of individuals who were arrested only once, while a larger ‘4+’ section would suggest a significant issue with recidivism. This visual is easy to understand and offers immediate insights into the extent of repeat offenses in the community. The bar graph complements the doughnut chart by providing a more detailed breakdown of the number of times individuals have been arrested. Each bar represents a different count of arrests (1 time, 2 times, etc.), allowing readers to see not just the proportion of repeat offenders, but also the distribution of how many times individuals are re-arrested. This level of detail is useful for understanding the scale of recidivism and identifying specific trends, such as whether a small group of individuals is responsible for a large number of repeat offenses.
Mapping Crime and Recurrence: A Detailed Look at Offense Categories in Repeat Arrests
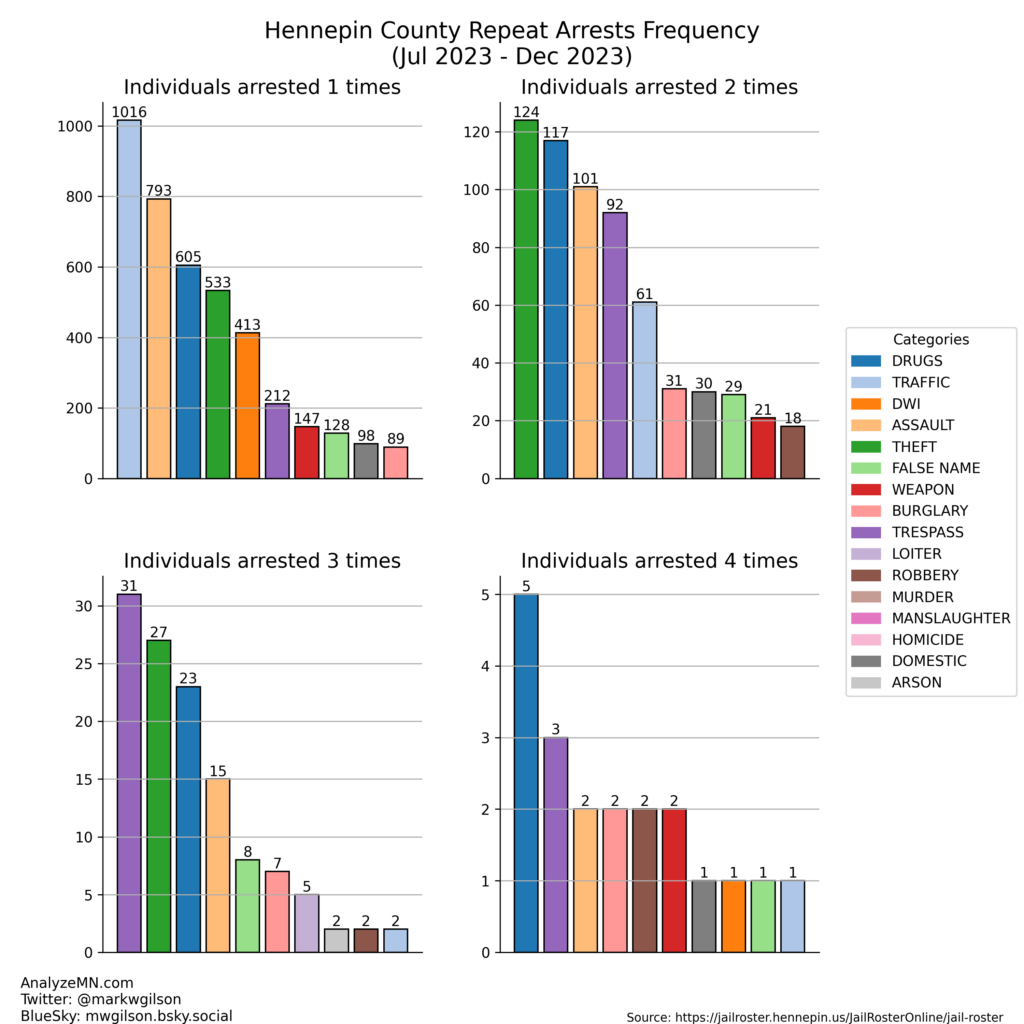
This final plot offers a unique perspective on repeat arrests in Hennepin County, focusing on the relationship between the frequency of an individual’s arrests and the categories of their offenses. Unlike the previous visualizations, which primarily looked at the overall distribution of arrests or the demographics of arrested individuals, this plot provides a nuanced view of how specific types of crimes correlate with repeat offenses. Each subplot in this visualization represents individuals arrested a certain number of times, with the bars indicating the frequency of different crime categories within each group. For example, one subplot might show the distribution of crime categories among individuals arrested twice, while another shows those arrested three times, and so on. This setup allows readers to see not just how many times individuals are arrested, but also what types of crimes they are repeatedly involved in. For the general public, this visualization can be particularly revealing. It highlights whether certain types of crimes, such as drug offenses or theft, are more likely to be associated with repeat offenses.
Conclusion
In summary, the series of visualizations developed offers a comprehensive and multifaceted view of arrest patterns in Hennepin County. These plots, encompassing age distributions, categories of offenses, and detailed analyses of repeat offenses, serve not just as statistical representations, but as crucial tools for understanding the complexities of criminal behavior in the community.
The first visualization, a stacked histogram, reveals how different types of crimes fluctuate over time, offering insights into seasonal or temporal trends. The second plot, a ridge plot, provides a demographic breakdown, highlighting age-related patterns within various crime categories. The third, combining a doughnut chart and bar graph, emphasizes the frequency of repeat offenses, offering a clear picture of recidivism in the county. Finally, the last visualization uniquely correlates the frequency of arrests with specific crime categories, shedding light on the types of offenses that are more likely to be associated with repeat offenders.
The value of these visualizations lies not only in the rich information they present but also in their ability to foster a deeper understanding of the societal implications of crime. Through the lens of data, they provide a unique viewpoint on the complex interactions and trends within the realm of criminal behavior, contributing significantly to a more nuanced and informed perspective on crime in Hennepin County.