The out-of-state battle for political dominance in Minnesota
Building upon the foundational insights from previous analyses, this article takes a deeper dive into the world of campaign financing, extending the focus beyond Minnesota’s state lines. It follows the analytical journey begun in “Unveiling Minnesota Campaign Contributions: A Data Visualization,” where the initial layers of local political financing were explored. This was further expanded in “Mapping Minnesota Campaign Contributions: A Zip Code Perspective,” offering a granular view of contributions at the community level.
Now, stepping beyond these boundaries, the analysis draws upon insights from “Visualizing Out-of-State Campaign Contributions” to understand the broader dynamics at play. Campaign finance, a complex and multifaceted field, is not limited by geographical confines. This comprehensive investigation focuses on out-of-state donors, crucial influencers in Minnesota’s political landscape. The origins and impacts of these contributions are scrutinized, identifying the states that hold significant sway over Minnesota’s political dynamics and revealing the intricate networks that shape state politics.
Exploring Top 5 Out-of-State Campaign Contributions by Year
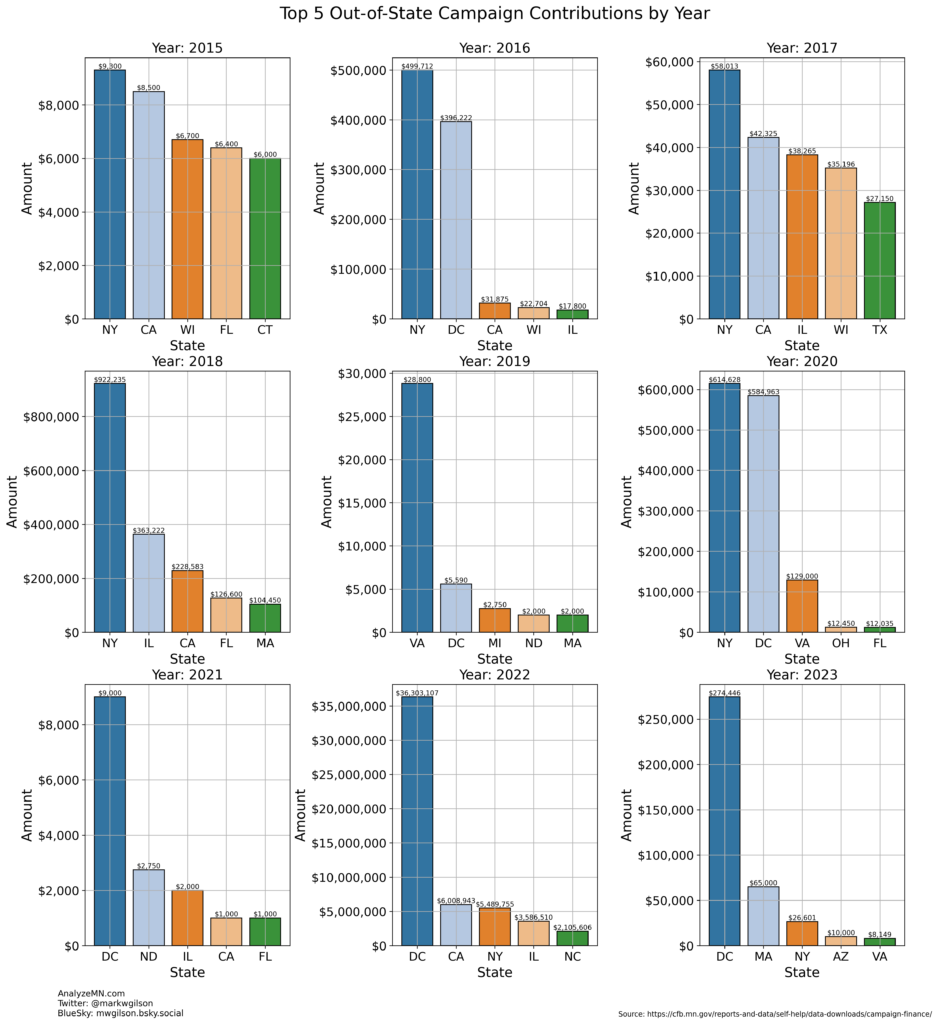
This plot offers a comprehensive analysis of political campaign financing, focusing specifically on the top five contributing states to Minnesota’s political landscape over a range of years. The plot illustrates the evolution of financial support from the top 5 states (evaluated yearly) contributing to Minnesota political campaigns. The bar plots, arranged in a series of subplots, each represent a different year, providing a clear visualization of how the top five states have varied in their financial contributions over time. Each state’s contribution is displayed in a distinct color with the exact dollar amount annotated, facilitating an intuitive understanding of the data. This visual journey, enriched by detailed formatting and annotations, offers an insightful glimpse into the changing landscape of campaign financing across multiple years.
#image_title
The table below shows the data in the plot above, but in tabular form.
Key Insights from the Top 5 Out-of-State Campaign Contributions by Year
Three critical takeaways emerge from this comprehensive exploration:
Shift in Leading Contributor: Prior to the year 2021, New York stood out as the primary contributor from outside Minnesota, consistently leading in campaign contributions. The data showcases the ebb and flow of political influence as different states took the lead in supporting Minnesota campaigns.
Evolution of Contribution Magnitude: A noteworthy aspect of this plot is the historical context it provides. Until 2022, the magnitude of out-of-state contributions remained relatively modest, with the yearly total contributions typically amounting to less than a million dollars. This underscores how political finance patterns can change over time, reflecting evolving priorities and circumstances.
2022: A Pivotal Year: The year 2022 emerges as a pivotal moment in the dataset. During this election cycle, the District of Columbia (DC) and California surged to the forefront as the top contributing states, collectively contributing over 40 million dollars to Minnesota’s political campaigns. This substantial increase in financial support from these regions highlights the impact of external factors and the ever-shifting landscape of campaign financing.
Out-of-State Maps
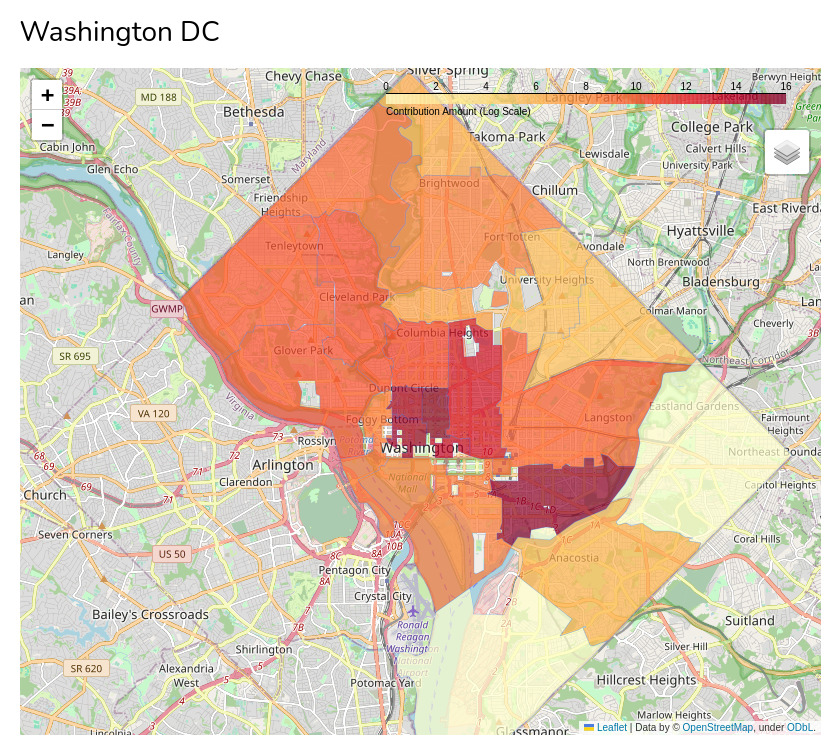
The staggering figures from 2022, marking it as a pivotal year in campaign contributions, set the stage for a more detailed exploration. The interactive maps below offer a visual representation of this financial influx, focusing on the top five contributing states. These maps not only showcase the substantial $36.3 million from DC and the significant $6 million from California but also bring to light the contributions from New York ($5.5 million), Illinois ($3.6 million), and North Carolina ($2.1 million). Each map serves as a gateway to understanding the geographical distribution of funds and the states’ varying degrees of influence on Minnesota’s political campaigns, offering an immersive and informative view of campaign financing in 2022.
Washington DC
California
New York
Illinois
North Carolina
Reflecting on the Impact: Concluding Insights on Out-of-State Campaign Contributions
In conclusion, this analysis has revealed a dynamic and evolving landscape of out-of-state campaign contributions to Minnesota’s political campaigns. The year 2022 marked a significant turning point, with unprecedented contributions from the District of Columbia and California. The interactive maps and detailed plots provided a deeper understanding of the geographical distribution and magnitude of these contributions. They highlighted not only the dominant role of certain states in specific years but also the broader trends and shifts over time. This exploration underscores the profound impact that out-of-state financing has on the political fabric of Minnesota, offering a lens through which the intricate interplay of regional influences and campaign financing can be understood.